Fracture Risk Following SCI
The vast majority of current evidence supports the importance of addressing fracture risk after SCI since there is a higher incidence of fragility fractures in this population (Table 1). The majority of fragility fractures occur following transfers or activities that involve minimal or no trauma (Comarr et al. 1962; Ragnarsson & Sell; 1981; Freehafer 1995; Akhigbe et. al 2015) where the distal femur and proximal tibia (knee region) are most at risk.
Recent findings from review studies in veterans (n=12,162) with SCI have found that 82.6% of all fractures were at the tibia/fibula, femur or hip (Fig 1). Further, individuals with SCI were less likely to receive surgical intervention, than people without SCI, although those with SCI who have surgery did not have increased mortality or adverse event rates (Bishop et. al, 2013; Bethel et. al, 2015). Delayed fracture union is common after SCI (Grassner et al. 2017). Following a fracture there is a five-year increased risk of mortality (Pelletier et al. 2014; Carbone et al. 2014).
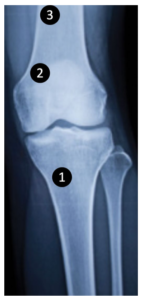
Figure 1. Many of the fractures that individuals with SCI sustain occur in the region of the metaphysis and epiphysis. Source: http://sci.washington.edu/info/forums/reports/osteoporosis.asp#dx
Risk factors for fragility fracture after SCI include:
- Sex
- Age at injury
- Time Post-Injury
- Type of impairment
- Low BMI
- Low knee region BMD, and
- Use of anticonvulsants, heparin, or opioid analgesics.
Women are at greater risk compared to men (Vestergaard et al. 1998; Lazo et al. 2001; Nelson et al. 2003; Garland et al. 2004). Increasing age and longer TPI (Frisbie 1997; McKinley et al. 1999; Garland et al. 2004; Garland et al. 2005) increases fracture risk which rises significantly at 10 years post-injury. Further, people with paraplegia have more fractures (Frisbie 1997) and those with complete injuries have greater bone mass loss compared with those with incomplete injuries (Garland et al. 2004; Garland et al. 2005).
A number of concurrent medications a patient is taking can also decrease or substantially increase fracture risk. These include but are not limited to: heparin, benzodiazepines, anticonvulsants, proton pump inhibitors, selective serotonin reuptake inhibitors and opioid analgesics. In a large retrospective cohort study of men with chronic SCI (n=6969, ≥ 2 years post-injury), the use of thiazide-type diuretics was associated with a 25% reduction in the risk of lower extremity fragility fractures (Carbone et al. 2013c). In contrast, the use of heparin (HR 1.48, CI 1.20-1.83), opioid analgesics (HR 1.80, CI 1.57-2.06), or anticonvulsants (HR 1.35, CI 1.18-1.54), especially the benzodiazepine sub-class (HR 1.45, CI 1.27-1.65), was associated with an increased risk of lower extremity fragility fractures in men with chronic SCI (≥ 2 years post-injury) (Carbone et al. 2013a, 2013b). Men with chronic SCI are at a slightly increased risk of lower extremity fragility fractures when exposed to proton pump inhibitors (HR 1.08, CI 0.93-1.25), selective serotonin reuptake inhibitors (HR 1.05, CI 0.90-1.23), or thiazolidinediones (HR 1.04, CI 0.68-1.61) (Carbone et al. 2013a, 2013b). However, these drugs and a prior history of fragility fracture or a history of fracture in a parent are known risk factors for the development of osteoporosis in the general population, and should, therefore, be considered when assessing fracture risk in SCI patients.
First Author Year N Age Range in Years (Mean±SD) |
Fractures | Risk Factors |
---|---|---|
Comarr 1962 N = 1,363 Age – 19-58 |
109 post-SCI incident lower extremity fractures occurred among 81 out of 1363 participants with traumatic SCI (57% paraplegia, 75% complete). Most common fractures were distal femur (37%), proximal femur (11%) | Motor complete SCI paraplegia |
Ragnarsson 1981 Study 1 N = 578 Age = 4-77 |
33 lower extremity fractures occurred among 23 out of 578 participants (15 men and 8 women) with chronic SCI (78% paraplegia, 91% complete). Most common fractures were supracondylar fractures of femur (33%), femoral shaft (30%) and tibial shaft (18%) | Motor complete SCI |
Ragnarsson |
(National SCI Data Research Centre); 52 lower extremity fractures occurred among 44 out of 3027 participants (37 men and 7 women) with chronic SCI (70% paraplegia, 64% complete). Most common fractures were ankle (24%, tibial shaft (20%) and femoral neck (17%) | N/A |
Frisbie 1997 N = 120 Age = 20-77 |
103 fractures (82% lower extremity) occurred among 40 out of 120 men with chronic SCI (91% traumatic, 30% paraplegia, 80% complete). Most common fracture sites were hip, femoral shaft, supracondylar femur, and tibia. Fracture incidence per age group: – 15 fractures/1000 participants years (20-39 years) – 31 fractures/1000 participants years (40-59 years) – 46 fractures/1000 participants years (60-79 years) |
Ageing; with fracture incidence rising with age |
Vestergaard 1998 N = 438 Age = 10-80 |
Overall fracture rate among 438 participants (309 men and 129 women) with SCI (94% traumatic, 55% paraplegia, 68% complete) was 2%/year. cumulative fracture incidence=21% | Women > men; men with a family history of fracture; TPI ≥3 years; level of SCI (cervical lesions with more fractures)* |
McKinley 1999 N = 20,804 population-based all ages |
20,804 participants over a 20-year timeframeTotal number of participants involved in study: 1yr post-SCI, 6,776; 2yrs post-SCI, 5,744; 5 years post-SCI, 4,100; 10yrs post-SCI, 2,399; 15yrs post-SCI, 1,285; 20yrs post-SCI, 500 Prevalence of lower extremity fractures in women – 1% (5 years post-SCI) – 2% (10 years post-SCI) – 3% (15 years post-SCI) – 6% (20 years post-SCI) Prevalence of lower extremity fractures in men – 1% (5 years post-SCI) – 1% (10 years post-SCI) – 2% (15 years post-SCI) – 2% (20 years post-SCI) |
Women > men; TPI |
Lazo 2001 N = 41 Age = 56±13 |
41 men with traumatic or Ischemic chronic SCI (57% paraplegia, 93% complete) 26 fractures (82% lower extremity) in 14 participants Most common fracture site was above knee (35%) |
Low femoral neck BMD (OR = 2.1, 95% CI = 1.27-3.43; per t-score decrement) |
Nelson 2003 N = 23 Age = 39-85 |
23 participants (22 men and 1 woman) with SCI (44% paraplegia) over 10 years (2.7% of the group). 31 fall-related fractures (97% lower extremity. Most common fracture sites were tibia/fibula (55%) and femoral fractures (35%) | Falls among those age 39-59 years |
Morse 2009b N = 315 Age = 55.0±14.4 |
39 fractures occurred among 30 men with SCI (50% paraplegia, 83% motor complete) during the first-year post-injury. Most common fracture sites were tibia/fibula (47.5%), distal femoral metaphysis (20%) and proximal femur (15%) | Motor complete SCI; post-injury alcohol consumption > 5 servings*/day |
Garland 2004 N = 152 Age = 20-71 |
9 out of 152 participants with post-SCI fractures (130 men and 22 women) with SCI (54% paraplegia, 67% motor complete). TPI: 12.9 ± 9.3 (range: 1.1 to 44.4) years. | Motor complete SCI; increasing age; low BMI |
Zehnder 2004a N = 98 Age = 18-60 |
39 fractures occurred among 15 paraplegic men with traumatic motor complete SCI. Overall fracture incidence was 2%/year. | TPI strata; 1%/year < 1-year post-SCI 1%/year 1-9 years post-SCI 3%/year 10-19 years post-SCI 5%/year (20-29 years post-SCI) Low knee region BMD; |
Eser 2005 N = 99 Age = 19-83 |
21 out of 99 participants (89 men and 10 women) with traumatic motor complete SCI (72% paraplegia) with lower extremity fractures | TPI; trabecular vBMD less than: 114g/cm3 distal femur 4% site; 72g/cm3 distal tibia 4% site; |
Garland 2005 N = 168 Age = 26-52 |
27 of 168 participants with chronic SCI (61% complete) with post-injury lower extremity fracture | Low BMD <25kg/m2; increasing age; low BMI; |
Carbone 2013a, 2013b N = 7,447 Age = 58±13 |
892 out of 7447 men with chronic traumatic SCI (56% paraplegia, 37% complete) had incident lower extremity fragility fractures over 5 years (12% of the cohort) | motor complete SCI; use of anticonvulsants; (use of benzodiazepine or use of multiple anticonvulsants), heparin use, opioid analgesia use 28mg of morphine equivalent |
Tan et. al 2014 N = 27 Age = 21 – 64 |
27 men with chronic traumatic SCI (70% paraplegia, 82% complete) 6/27 men with post-SCI osteoporotic fractures |
Higher level of adiponectin among wheelchair users Range of values 5657 ± 3003 (wheelchair users with history of fractures) |
Akhigbe et. al 2015 N = 140 Age = 56.5±12 |
140 participants (137 men, 2 women, and 1 unknown) with chronic traumatic SCI (67% paraplegia, 51% complete) with 155 incident lower extremity fractures. Common fracture sites were tibia/fibula (54%) and femur (33%) | Transfers account for 1/3 of fractures |
Bethel et. al 2016 N = 22,516 Age = 55±13 |
3365 participants (3,246 men and 119 women) with chronic SCI and incident fractures (66% traumatic, 44% non-traumatic, 38% with paraplegia, 42% motor complete) A majority ((80%) were lower extremity fractures; tibia/fibula (26%), femur (18%), and the hip (13%) | White race; Traumatic etiology of SCI; paraplegia; Motor complete SCI; TPI; Use of anticonvulsants, Use of opioids Use of benzodiazepines; History of prevalent fractures; higher Charlson Comorbidity Index score; Women aged ≥ 50 years |
Fracture thresholds are values below which fragility fractures begin to occur, whereas fracture breakpoints are values below which the majority of fractures occur (Garland et al. 2005). Knee region areal BMD (aBMD) and volumetric (vBMD) thresholds for fracture and breakpoint have been identified (Mazess 1990; Eser et al. 2005; Garland et al. 2005). BMD thresholds are described on Table 2.
Name | Value | Definition |
---|---|---|
Fracture threshold | ≤ 0.78 g/cm2 (aBMD) < 114 mg/cm3 (vBMD-femur) < 72 mg/cm3 (vBMD-tibia) |
Knee region BMD values below which fragility fractures occur |
Fracture breakpoint | < 0.49 g/cm2 (aBMD) |
Knee region BMD values at which the majority of fragility fractures occur |
Column 1 Value 3 | Column 2 Value 3 | Column 3 Value 3 |
BMD = bone mineral density; aBMD = areal BMD; vBMD = volumetric BMD.
Reproduced from Craven BC, Robertson LA, McGillivray CF, Adachi JD (page 7).1 © 2009
Thomas Land Publishers, Inc. www.thomasland.com. Reprinted with permission.
We recommend documenting your patient’s fracture risk by completing the risk factor profile checklist (Craven et al. 2008; Craven et al. 2009). We propose that the presence of ≥ 3 risk factors implies a moderate fracture risk, and ≥ 5 risk factors implies a high fracture risk (Table 3).
Risk Factors |
---|
Age at Injury < 16 years |
Alcohol Intake > 5 servings/day |
Body Mass Index < 19 |
Duration of SCI ≥ 10 years |
Woman |
Motor Complete (AIS A-B) |
Paraplegia |
Family history of fracture in men |
Anticonvulsant use (i.e., Tegretol, Depakote Gabapentin – Neurontin) |
Spasticity Medication |
Opioid analgesia use (≥28 mg morphine for 3 months) |
Prior fragility fracture** |
SSRI |
PPI |
Knee region BMD below the fracture threshold** |
**The big 2** |
Gap: Fracture Management After SCI |
---|
Source of evidence |
Recognizing a fracture
|
Management |
First Author Year N Age Range in Years (Mean±SD) |
Fractures | Risk Factors |
---|---|---|
Bethel et al. 2015 1281 56±12 |
1,281 men with traumatic chronic SCI (57% paraplegia, 54% complete) with 1,979 incident fractures consisting of 345 (17%) upper extremity fractures and1634(83%)lower extremity fractures. Most common upper-extremity fracture sites were the humerus (28%) and lower-extremity fracture sites were tibia/fibula (33%), femur (26%) and hip (16%) |
Traumatic SCI-TPI>2 years |
Bethel et al. 2015 compared results of incident fracture treatment (surgical vs. non- surgical) among male veterans with chronic SCI. The study comprised 1,979 incident fractures that occurred among 1281 veterans over 6 years. The majority of fractures occurred in lower extremities (~83%), and the majority of these fractures were treated nonsurgically (~90%). The authors reported that there was a significant difference in the level of injury and fracture treatment modality, surgery treatment being used more among individuals with paraplegia (p = 0.04). However, there were no significant fracture treatment-related differences in mortality rates.