Introduction
It is estimated that approximately 85,000 Canadians live with a traumatic or non-traumatic spinal cord injury (SCI) with over 4000 new cases per year in Canada, and of which about half are from traumatic causes (Noonan et al. 2012). In the United States, there are approximately 12,000 cases of SCI per annum (Foundation for Spinal Cord Injury Prevention, 2009; Myers et al. 2012). The majority of SCIs (80%) occur in individuals who are under 30 years of age (ICORD 2003; Rick Hansen Spinal Cord Injury Registry 2004). Persons with SCI currently have an increased life expectancy owing to improvements in medical treatment (Rick Hansen Spinal Cord Injury Registry 2004), and therefore, are susceptible to the same chronic conditions across the lifespan as able-bodied persons. In fact, cardiovascular disease (CVD) is the leading cause of mortality in people both with and without SCI (Whiteneck et al. 1992). Unfortunately, there is considerable evidence indicating an earlier onset and/or prevalence of various chronic diseases (including CVD, type II diabetes, and osteoporosis) in persons with SCI (Yekutiel et al. 1989; Whiteneck et al. 1992; DeVivo et al. 1993; Bauman et al. 1999b; Groah et al. 2001; Garshick et al. 2005; Warburton et al. 2007b). The prevalence rate of symptomatic CVD in SCI is 30–50% in comparison to 5%–10% in the general able-bodied population (Myers et al. 2007). Moreover, the prevalence of asymptomatic CVD has been estimated to be 60%–70% in persons with SCI (Bauman et al. 1993; Bauman et al. 1994). It also appears that persons with SCI have increased CVD-related mortality rates and those with tetraplegia experience mortality at earlier ages in comparison to able-bodied individuals (Whiteneck et al. 1992; DeVivo et al. 1999; Myers et al. 2007). These are alarming statistics, which place a significant burden upon the patient, his/her family, and society as a whole.
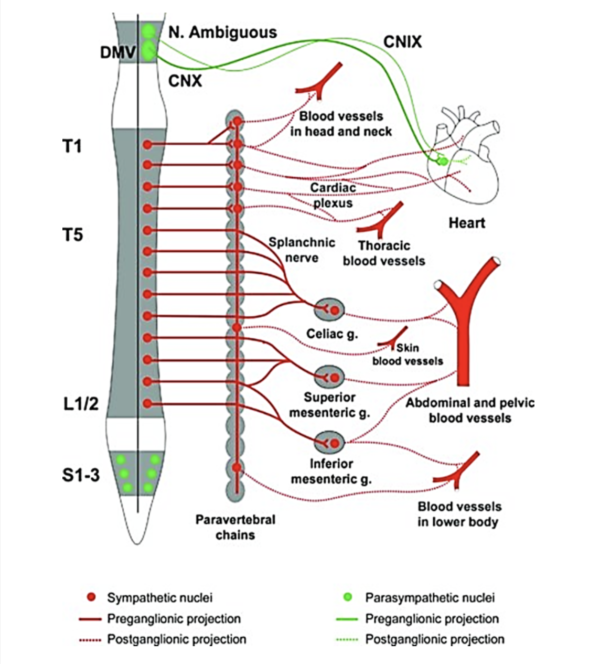
Cardiac function is strongly influenced by the lesion level; individuals with a T1 lesion will not have any supraspinal sympathetic control, those with a T1-T5 lesion will have partial preservation, while those with an injury below T5 will have full supraspinal sympathetic control of the heart and upper body vasculature (West et al. 2012). Adrenergic dysfunction, poor diet, and physical inactivity are thought to play key roles in the elevated risk for CVD in SCI (Bravo et al. 2004; Warburton et al. 2007b). Additionally, interruption of descendent sympathetic pathways and unopposed vagal tone cause a decrease in compensatory sympathetic activities, elevating the risk for cardiac bradycardia, hypotension, and hypothermia, by lack of sympathetic activity (Grigorean et al. 2009; Krassioukov et al. 2007). Cardiac dysfunctions are often life-threatening in acute SCI; however their risks diminish in chronic SCI (Grigorean et al. 2009). Sympathetic control of the cardiovascular system originates primarily from T1 to T4 spinal segments (Phillips and Krassioukov 2014). It is important to take into account that individuals with lesions at or above these levels may have an impaired response to exercise.
Cite this Chapter: Warburton DER, Krassioukov A, Sproule S, Eng JJ (2018). Cardiovascular Health and Exercise Following Spinal Cord Injury. In Eng JJ, Teasell RW, Miller WC, Wolfe DL, Townson AF, Mortenson WB, Hsieh JTC, Noonan VK, Loh E, Sproule S, McIntyre A, Querée M, editors. Spinal Cord Injury Rehabilitation Evidence. p 1-68. Available at: https://scireproject.com/evidence/cardiovascular-health-and-exercise/introduction/

Physical inactivity is a major independent risk factor for CVD and premature mortality (Warburton et al. 2006; Warburton et al. 2010). Unfortunately, physical inactivity and marked deconditioning are highly prevalent among persons with SCI (Jacobs and Nash 2004). Also, it appears that the ordinary activities of daily living are not adequate to maintain cardiovascular fitness in persons with SCI (Hoffman 1986). It is likely that low levels of physical activity and fitness (as a result of wheelchair dependency) explain (in part) the increased risk for CVD (Myers et al. 2007). Marked inactivity associated with SCI has been associated with lower high-density lipoprotein (HDL) cholesterol (Schmid et al. 2000; Manns et al. 2005), elevated low-density lipoprotein (LDL) cholesterol (Schmid et al. 2000), triglycerides (Schmid et al. 2000; Manns et al. 2005), total cholesterol levels (Schmid et al. 2000), abnormal glucose homeostasis (Elder et al. 2004; Manns et al. 2005), increased adiposity (Elder et al. 2004; Manns et al. 2005), and excessive reductions in aerobic fitness (Schmid et al. 2000; Manns et al. 2005). It is important to note that SCI presents an additional risk for CVD above that seen in able-bodied individuals owing to the marked decrease in physical activity and injury-related changes in metabolic function (Bravo et al. 2004). Moreover, a reduction in cardiovascular fitness may also lead to a vicious cycle of further decline leading to a reduction in functional capacity and the ability to live an independent lifestyle. Based on the available literature, it is clear that effective exercise interventions are required to slow the progression of multiple risk factors for CVD and other chronic diseases (e.g. obesity, type 2 diabetes) in persons with SCI. In addition, literature from other populations suggest that exercise combined with other healthy lifestyles such as a high fibre, low fat diet may have even further positive impact on cardiovascular health (Golay et al. 2013) and are likely relevant to SCI populations as well (Nash et al. 2012).
The current chapter summarizes and updates the literature regarding the risk for CVD in persons with SCI. This chapter also critically evaluates the level of evidence regarding the effectiveness of varied forms of exercise rehabilitation in increasing cardiovascular fitness and attenuating the risk for CVD in persons with SCI. Table 1 contains a definition of the commonly used terms and/or abbreviations in this chapter.
